Electric car app
Electric cars – Magic pill or poison for electricity prices – the $8 billion question
We have challenged ourselves to tell the story of our new EV app in pictures. But we would also love the data geeks and tech gurus to play with the app. Access to all the posters in high resolution is available by clicking on the last image.

Unlocking lower energy prices
The first in our set of graphics shows that electric cars offer great advantages – a greener way of filling up at a cheaper cost. But our app wanted to know how electric cars will impact electricity prices – will the average cost per unit change when we have a mass of electric cars on the road. We looked at the network costs which are about 40% of the electricity bill, and imagined an Australia in 2050 where 60% of cars are electric.
As you can see, the answer depends on when people charge their car. If everyone fills up during the peak evening period, we are in for a rocky ride. Expect average prices to rise by 30% plus for each unit of energy consumed. But charge in the day and overnight, and expect savings of around 20%. The difference will be about $400 for a household, or about $8 billion in total by 2050 (in today’s dollars) just for network prices. And this does not even include expected savings from generation costs.

Graphic 1 - Unlocking lower energy prices
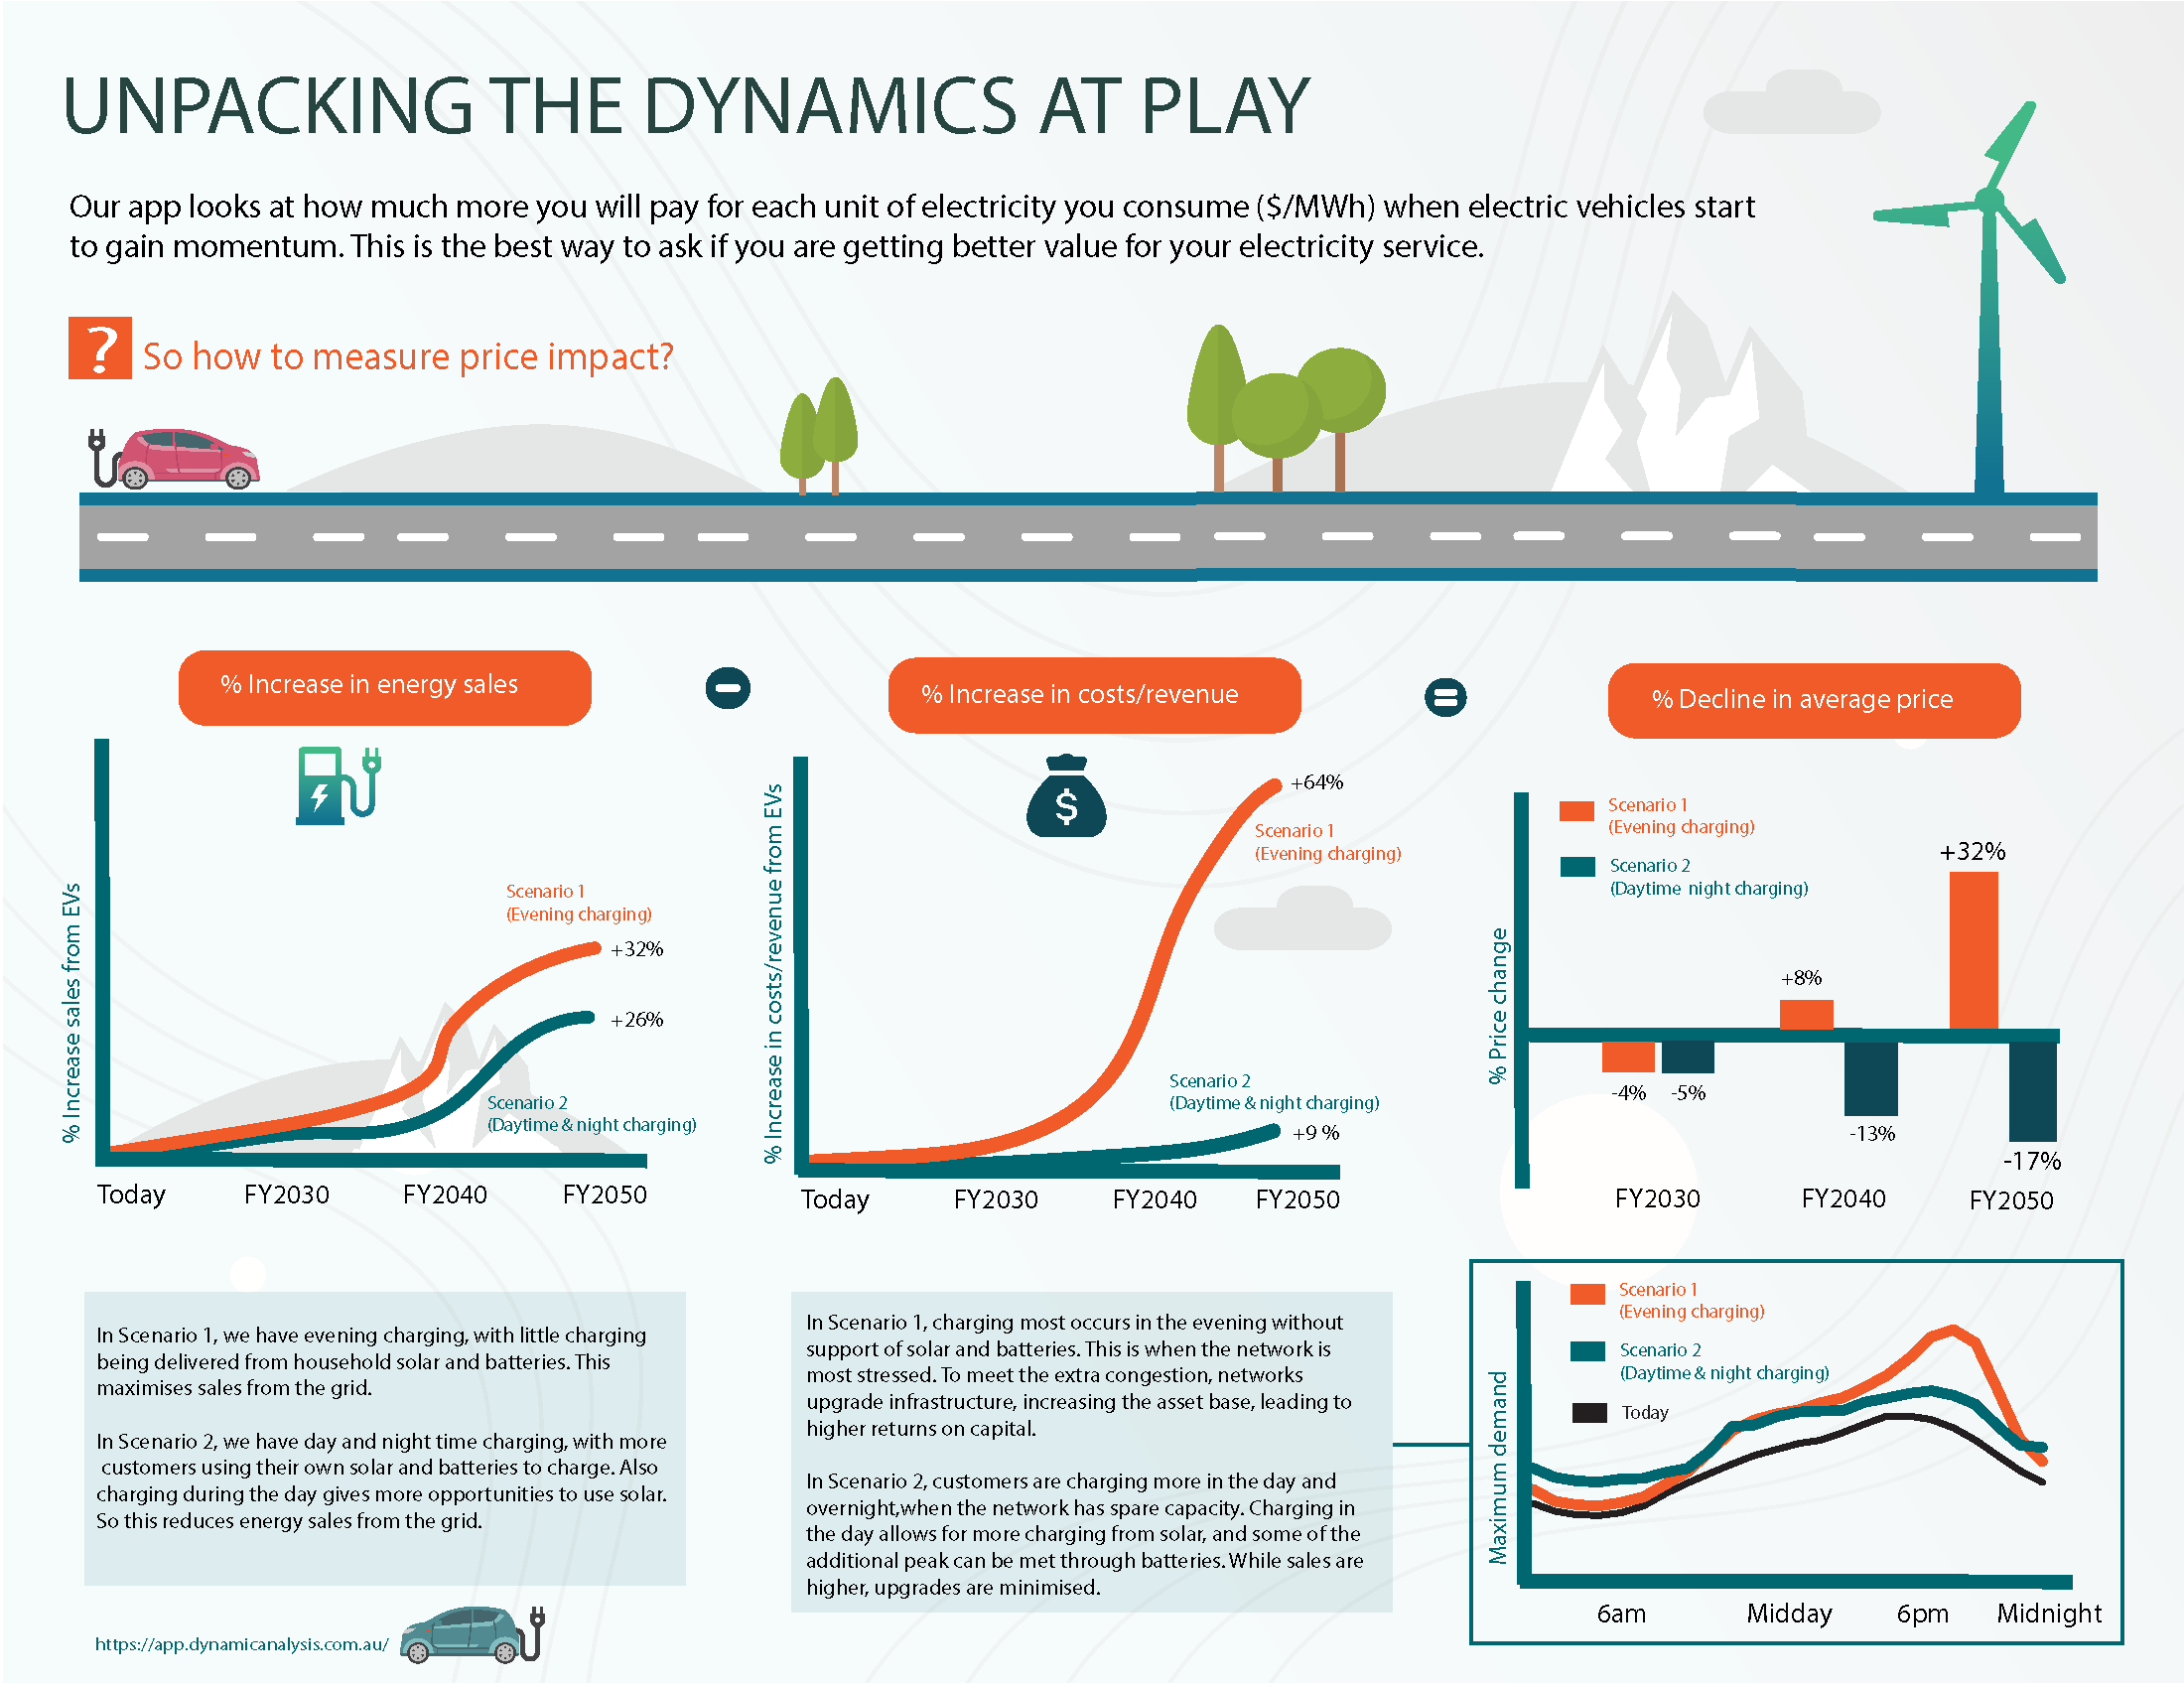
Unpacking the dynamics at play
The second graphic unpacks the logic. The network is built to supply maximum demand on a very hot or cold evening when people are trying to warm or cool the house. Now if we charge electric vehicles at the same time, the network will need to be upgraded. But if we charge when the network has spare capacity such as the day or overnight, we will not have to build as much new network. Plus we get to use the network when it has spare capacity, improving utilisation and reducing average costs.
Second poster - unpacking the dynamics at play
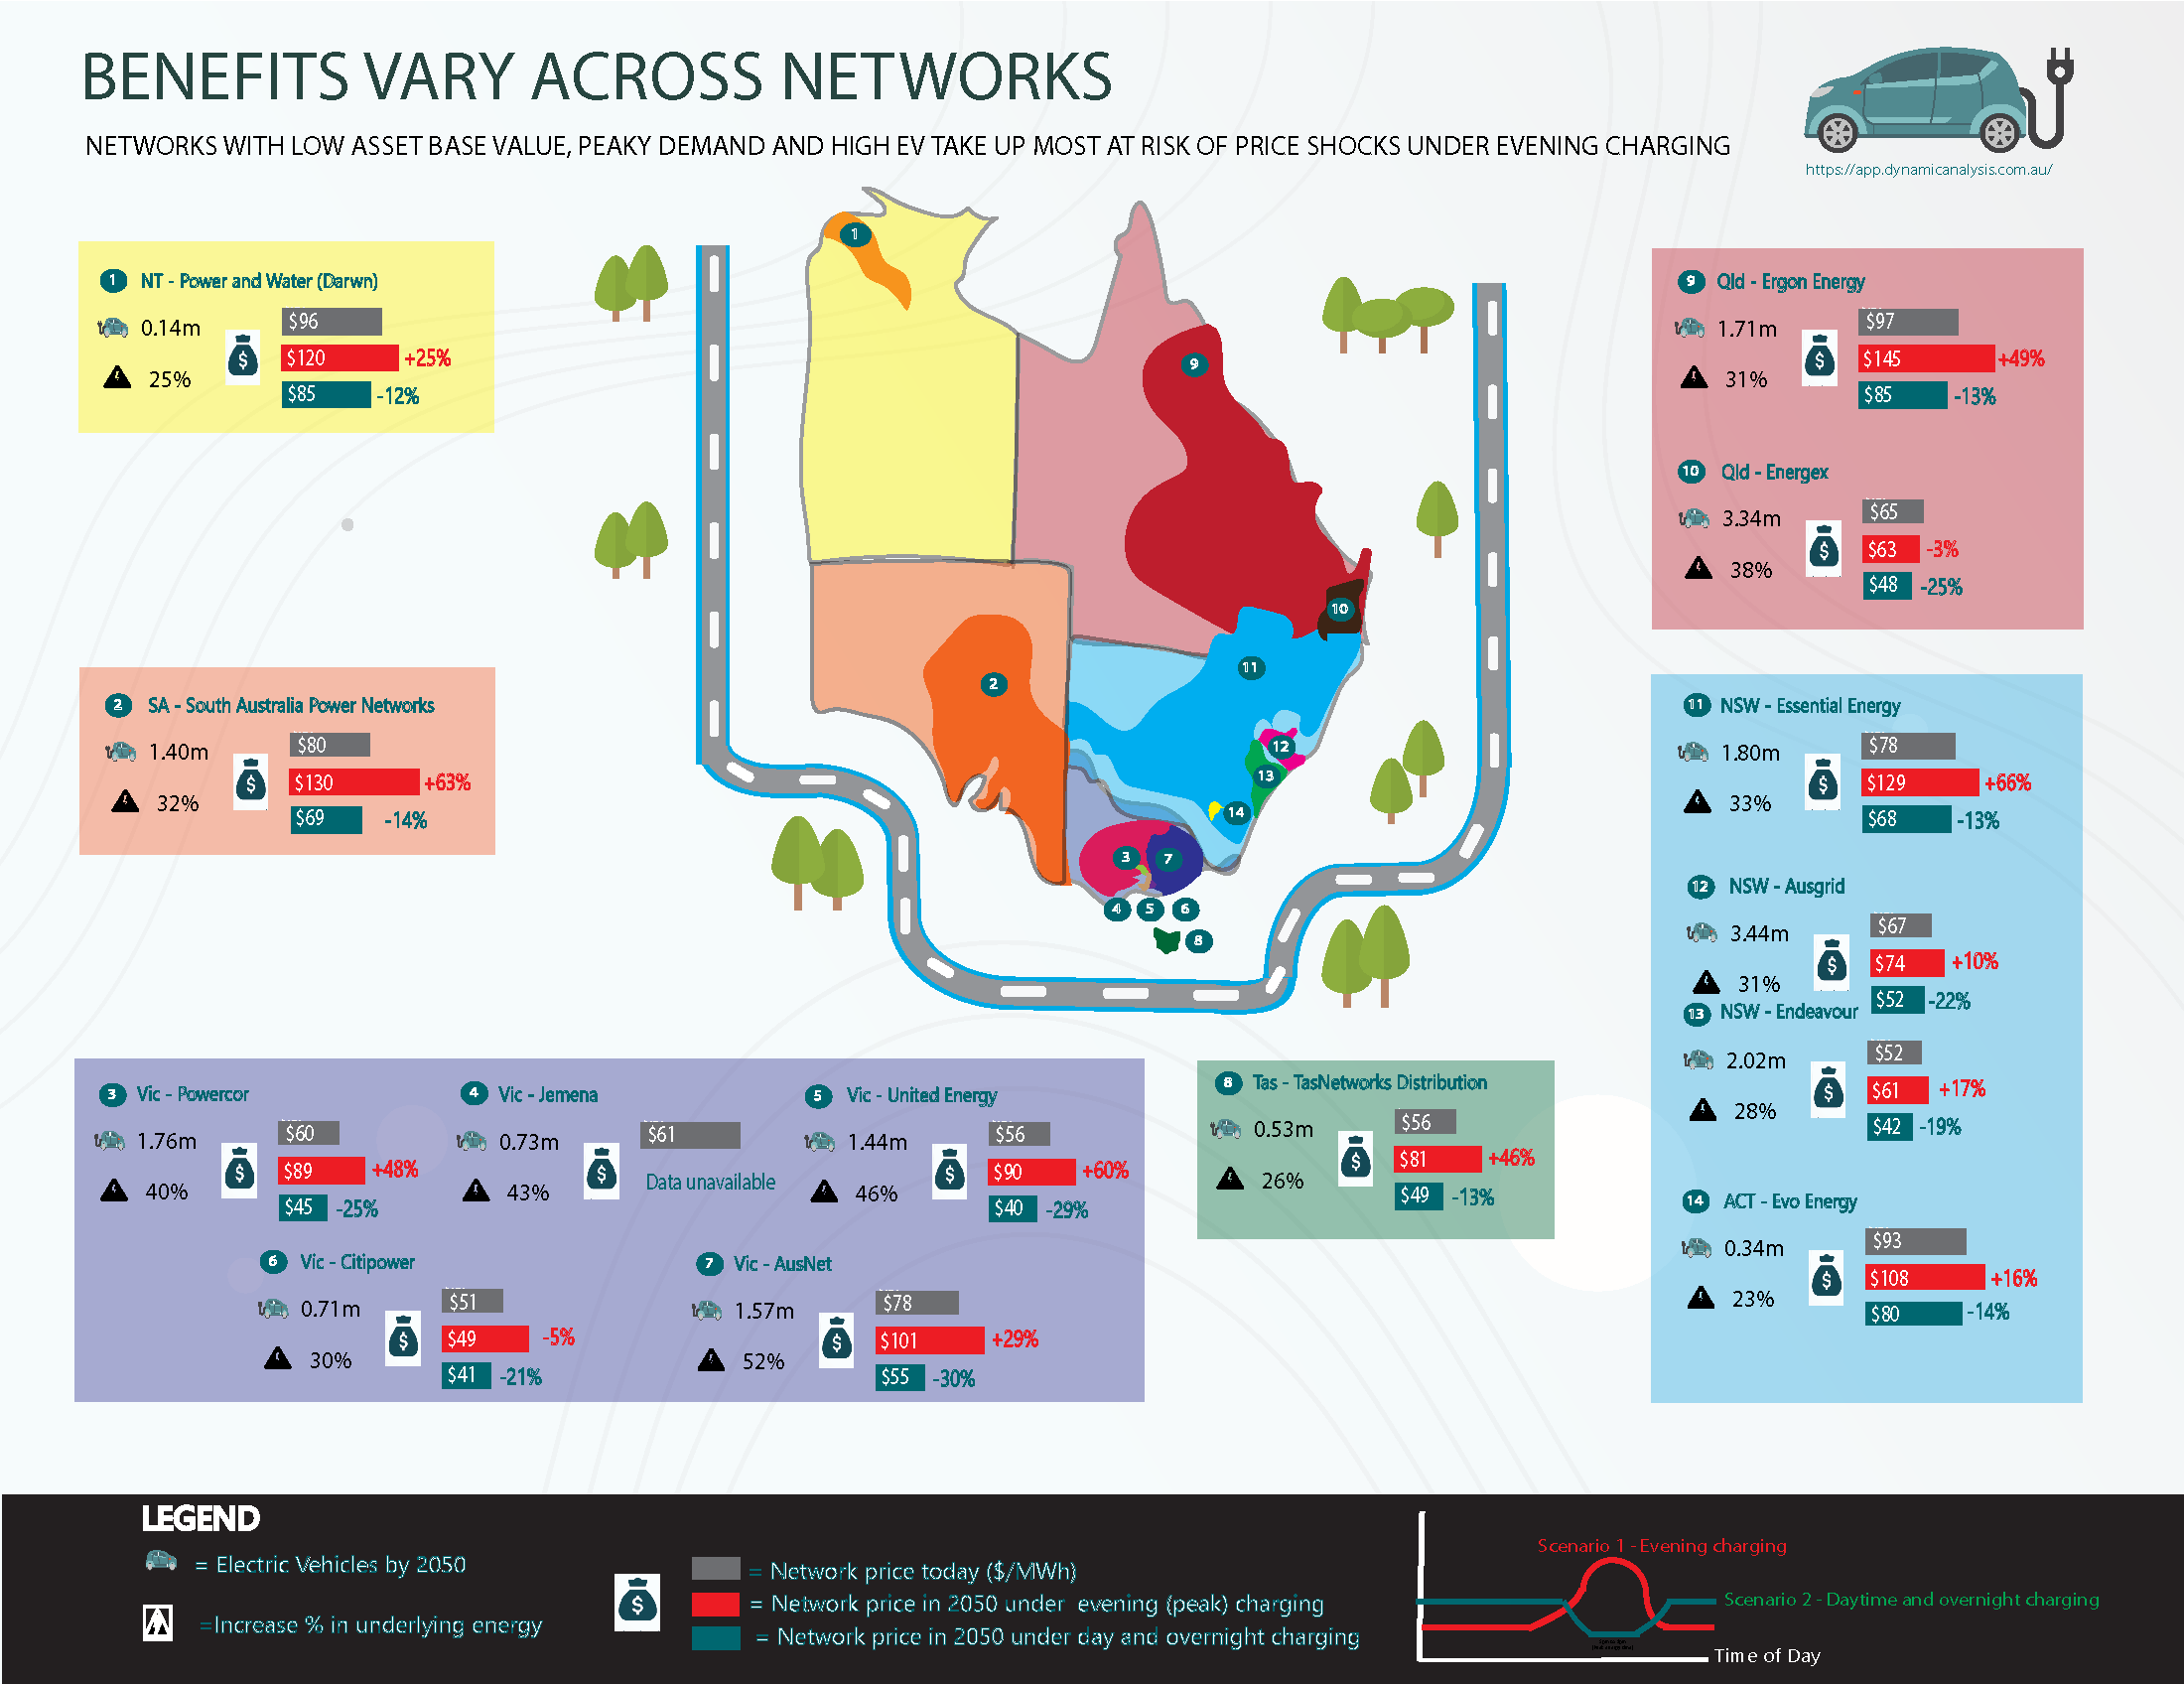
Benefits and risks vary across networks
The third graphic shows that customers benefit across all networks when people charge in the day and overnight rather than the evening peak. But interestingly, for some networks the price difference will be enormous. Networks with a very low regulatory asset base (RAB) relative to replacement cost are most at risk of a price shock. In these networks, even a small injection of capital expenditure sends the RAB skyrocketing, and takes prices with it. More on this story in future posts, but fair to say that policy makers need to pay attention to probably the most serious risk of price shocks. High EV take up and peaky demand profiles also play a part in explaining differences.
Graphic 3 - Benefits vary across networks
Maximising benefits of EVs
So the message is that EVs hold the secret to lowering prices if we can incentivise people to charge in the day and overnight. The fourth graphic shows that we need to incentivise EV take up, but networks also need to have the pricing incentives and charging technology in place to entice people to charge in the day and overnight. I am all for an EV specific network tariff that must be passed on by retailers. This could be implemented without making changes to any other tariffs, which has been the key issue in moving forward tariff reform. It also sends a clear signal that rewards are available for day and night charging.

Graphic 4 - Maximise benefits of EVs
Calculation steps
My last graphic was my most difficult – how to make the modelling steps less nerdy, but also to show that the inputs and outputs make sense. Now modelling always involves assumptions – the most tenuous is how an increase in peak demand flows onto building more assets. Shout out to any network who wants to take the modelling one step further.
Most of all I want people to play with the app. So I have constructed an app that allows you to input different variables and see the impact on prices and demand over time. Best of all I also have uploaded the model with all the data sources and calculations. There is so much data out there – here I have housed it in one spot. But the model can become more sophisticated with time - autonomous vehicles, super charging, postcode analysis, revenue impact by asset class - all of this awaits. The ideas here is to drive policy through accessible and transparent data analysis, where individual assumptions on the future are clearly spelt out. Its called mechanistic modelling and is used widely in ecology.

Graphic 5 - Calculation steps for the EV app
More high resolution images are available by clicking below.

Posters in high resolution (click on the image)